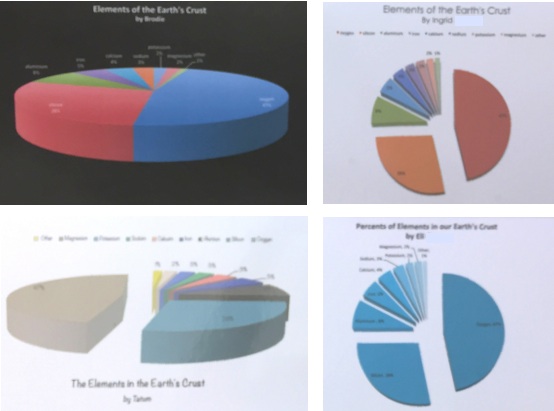
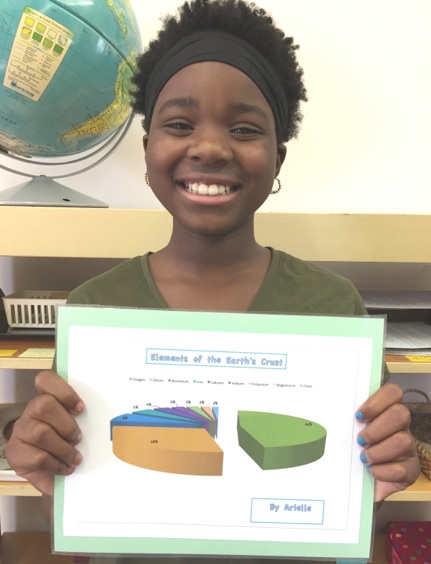
As part of their geology studies with teacher Nancy Buchman, 4th-6th graders learned about the elements in the Earth’s crust. Sixth graders learned new Excel skills by entering data and then creating a pie or circle chart of the elements. The were challenged to try out various chart styles, color themes, and fonts to make their chart unique.


